import matplotlib_venn
from matplotlib_venn import venn3
print("matplotlib_venn", matplotlib_venn.__version__)
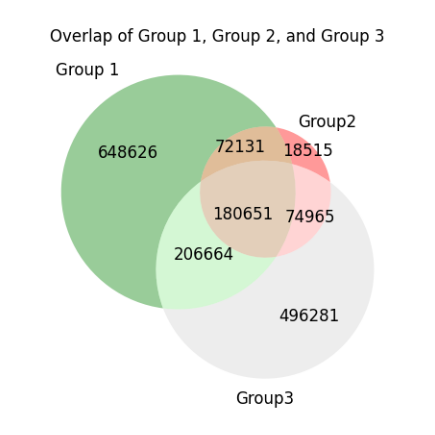
fig_title="Overlap of Group 1, Group 2, and Group 3"
path="/path/to/the/directory/for/plots"
fig_name=f'{path}/venn.png'
only_group1 = 648626
only_group2 = 18515
only_group3 = 496281
group1_and_group2 = 72131
group2_and_group3 = 74965
group1_and_group3 = 206664
overlap123 = 180651
# Create Venn diagram with custom colors
venn = venn3(
subsets=(only_group1, only_group2, group1_and_group2,
only_group3, group1_and_group3, group2_and_group3, overlap123),
set_labels=('Group 1', 'Group 2', 'Group 3'), # Labels for each group
set_colors=('green', 'red', 'lightgrey') # Fill colors for each group
)
# Adjust font size for the numbers shown inside the diagram
for label in venn.subset_labels:
if label: # Skip labels that don't exist (empty subsets)
label.set_fontsize(12)
# Add a plot title
plt.title(fig_title, fontsize=12)
# Save the plot
plt.savefig(fig_name, bbox_inches = 'tight', dpi=300)
# Display the Venn diagram
plt.show()