Plot grouped bar plot with two subplots
Python code to plot a grouped bar plot with two subplots using matplotlib and seaborn.
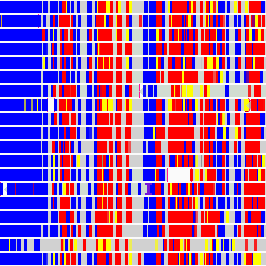
Python code to plot a grouped bar plot with two subplots using matplotlib and seaborn.
Quickly show all your terminal shortcuts using a single command to help you keep track of them all.
Instead of constantly writing out the SSH command to connect to remove servers, create an alias for it.
Sometimes we can only download a citation from PubMed but it cannot be readily imported into some of the common citation mangers because it is a .nbib file, ...
Python code to plot a Venn diagram using venn3 package from matplotlib.
Use Python dictionaries to store and process multiple related dataframes where the keys describe the dataframes and make your code more human readable, short...
How to print package versions in the current environment in Jupyter